Comparative Study of
Equations of State for the Dew Curves Calculation in High Pressure Natural Gas
Mixtures*
Estudio Comparativo de Ecuaciones de
Estado para el Cálculo de Curvas de Rocío en Mezclas de Gas Natural a Alta
Presión*
Estudo Comparativo de
Equações de Estado para o Cálculo de Curvas de Orvalho em Misturas de Gás
Natural de alta Pressão*
Natalia Prieto Jiménez **
Germán González Silva ***
Universidad Industrial de Santander– Colombia
Fecha
de Recibido: Marzo 21 del 2018
Fecha
de Aceptación: Noviembre 03 de 2018
Fecha
de Publicación: Enero 01 de 2019
DOI: http://dx.doi.org/10.22335/rlct.v11i2.743
*Este artículo es resultado de la investigación
doctoral titulada “Estudio de la separación de fases del gas natural a alta
presión usando Dinámica de Fluidos Computacional” y de la convocatoria “Capital
Semilla para Investigación” de la Vicerrectoría de Investigación y Extensión de
la Universidad Industrial de Santander. Proyecto 2370 del año 2017.
**Candidata a Doctor en Ingeniería Química de la
Universidad Industrial de Santander, Colombia. Filiación: Grupo de
Investigación en Energía y Medio ambiente de la Universidad Industrial de
Santander. Correo electrónico: natispj@gmail.com.
Orcid: https://orcid.org/0000-0001-9178-7758
***Doctor en Ingeniería Química de la Universidade
Estadual de Campinas (Brasil) y Profesor Asistente de la Escuela de Ingeniería
de Petróleos de la Universidad Industrial de Santander. Filiación: Grupo de
Modelamiento de Procesos de Hidrocarburos – Universidad Industrial de
Santander. Correo electrónico: germangsilva@gmail.com Orcid: https://orcid.org/0000-0002-4642-1092
___________________________________________________
Abstract
The
success during the operation of natural gas processing plants depends on the
correct estimation of thermodynamic properties of the system. This paper
calculates the equilibrium curves of real and synthetic natural gas mixtures
means of three Equations of State (EOS). These equilibrium curves were
constructed and compared with experimental data found in the literature
covered. The results showed that, above 4 MPa the Peng-Robinson equation
presented a considerable deviation with respect to the experimental data,
reaching an absolute error of 4.36%; therefore, the GERG2008 equation is
recommended for systems that operate at high pressures when the components
present in the mixture apply.
Keywords:
Gas
Mixtures, Dew curves, Equations of State; Peng-Robinson, Soave-Redlich-Kwong,
GERG2008.
Resumen
El éxito durante la
operación de plantas de tratamiento de gas natural depende de la correcta
estimación de las propiedades termodinámicas del sistema. Este artículo calcula
las curvas de equilibrio de mezclas de gas natural reales y sintéticas por
medio de tres ecuaciones de estado (EOS). Estas curvas de equilibrio fueron
construidas y comparadas con datos experimentales presentes en la literatura.
Los resultados mostraron que, por encima de 4 MPa la ecuación de Peng-Robinson
presentó una desviación considerable con respecto a los datos experimentales,
alcanzando un error absoluto de 4,36%; por lo cual se recomienda la ecuación de
GERG2008 para sistemas que operen a altas presiones cuando los componentes
presentes en la mezcla apliquen.
Palabras clave:
Mezclas de gas,
Curvas de rocío, Ecuaciones de estado, Peng-Robinson, Soave-Redlich-Kwong,
GERG2008.
Resumo
O
sucesso na operação de usinas de tratamento de gás natural depende da correta
estimação das propriedades termodinâmicas do sistema. Este artigo calcula as
curvas de equilíbrio de misturas de gás natural reais e sintéticas por meio de
três equações de estado (EOS). As curvas de equilíbrio foram construídas e
comparadas com dados experimentais presentes na literatura. Os resultados
mostraram que, acima de 4 Mpa a equação de Peng-Robinson apresentou um desvio
considerável em relação aos dados experimentais, atingindo um erro absoluto de
4,36%; por tanto, é recomendável a equação de GERG2008 para sistemas que operam
em alta pressão quando os componentes presentes no sistema apliquem.
Palavras-chave:
Misturas
de gás, Curvas de orvalho, Equações de estado, Peng-Robinson,
Soave-Redlich-Kwong, GERG2008.
Introduction
Natural
gas is a complex mixture of hydrocarbons, composed mainly of methane  ,
with significant amounts of ethane
,
with significant amounts of ethane
 ,
propane
,
propane  ,
butane
,
butane  and
some traces of heavy hydrocarbons and certain inorganic compounds
(Mokhatab,
Poe, & Mak, 2015). Its use
as a fossil fuel mostly depends on the treatment carried out before being sent
to the transport network. The processing carried out on natural gas is divided
into three stages: separation of the present phases; dew point adjustment and
re-compression (Khanwelkar,
2015). Conventional
processes of natural gas phases separation are carried out at operating
pressures near atmospheric, thus the third stage is essential (Figure
1). According to data from
Colombian natural gas plants, 12% of Operating Expenditures (OPEX) is
exclusively directed to compression systems. The high energy costs generated by
the re-compression led several authors to recommend that phase separation be
carried out at high pressure (Austrheim,
Gjertsen, & Hoffmann, 2008; Brigadeau, 2007; Zaghloul, 2006).
However, phase separation at high pressure is a complex
process. As the operating pressure within the equipment increases, the density
difference between the liquid phase and the gas phase considerably decreases,
as the surface tension does, which leads to the condensation of fine droplets
and therefore they are easily re-entrainment by the gas phase (Kharoua,
Khezzar, & Saadawi, 2013; Laleh, Svrcek, & Monnery, 2012).
and
some traces of heavy hydrocarbons and certain inorganic compounds
(Mokhatab,
Poe, & Mak, 2015). Its use
as a fossil fuel mostly depends on the treatment carried out before being sent
to the transport network. The processing carried out on natural gas is divided
into three stages: separation of the present phases; dew point adjustment and
re-compression (Khanwelkar,
2015). Conventional
processes of natural gas phases separation are carried out at operating
pressures near atmospheric, thus the third stage is essential (Figure
1). According to data from
Colombian natural gas plants, 12% of Operating Expenditures (OPEX) is
exclusively directed to compression systems. The high energy costs generated by
the re-compression led several authors to recommend that phase separation be
carried out at high pressure (Austrheim,
Gjertsen, & Hoffmann, 2008; Brigadeau, 2007; Zaghloul, 2006).
However, phase separation at high pressure is a complex
process. As the operating pressure within the equipment increases, the density
difference between the liquid phase and the gas phase considerably decreases,
as the surface tension does, which leads to the condensation of fine droplets
and therefore they are easily re-entrainment by the gas phase (Kharoua,
Khezzar, & Saadawi, 2013; Laleh, Svrcek, & Monnery, 2012).
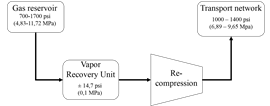
Figure 1. Schematic diagram
of the conventional gas-liquid separation process.
For
the proper design and analysis of separation systems and high-pressure natural
gas processing plants, it is important to know the thermodynamic properties of
the mixture, which can be calculated by means of Equations of State (EOS) or
empirical correlations (Guo
& Ghalambor, 2014; Shoaib, Bhran, Awad, El-Sayed, & Fathy, 2018).
The most relevant properties of the mixture are
revealed by the thermodynamic equilibrium curves, showing, in addition to the
bubble and dew points, the zone where the liquid and gas phases coexist in
equilibrium and, consequently, the range of operating conditions of pressure
and temperature over which multiphase separation is possible (Jia,
Wu, Li, & He, 2017). The cubic equations of Soave-Redlich-Kwong – SRK (Soave,
1972) and Peng-Robinson
– PR (Peng
& Robinson, 1976) are two EOS widely accepted and
used at academic and industrial level for the calculation of thermodynamic
properties of natural gas. Additionally, Kunz and Warner (Kunz
& Wagner, 2012) developed
a specific equation of state for natural gas, called GERG2008 (by the acronym
of Groupe Européen de Recherches Gazières - European Gas Research Group
and the year it was developed) that is based on the concept of multi-fluid and
it is explicit for Helmholtz free energy. The correct estimation of the
thermodynamics properties of two-phase and three-phase mixtures results in an
important input parameter for the development of different processes in the Oil&Gas
industry using numerical simulation through Computational Fluid Dynamics (CFD)
techniques (González-Silva,
Matos, Martignoni, & Mori, 2012; Jiménez, Hodapp, Silva, & Mori, 2010;
Silva, Jiménez, & Salazar, 2012; Silva, Prieto, & Mercado, 2018).
Cubic
Equations of State
The
simple mathematical structure of the cubic equations of state allows its
practical use in technical and academic applications (Galatro
& Marín-Cordero, 2014). These two equations
are characterized by having the same general form (Poling,
Prausnitz, & Connell, 2000a), which can be expressed explicit in the pressure as shown
in the equation (1)
or depending on the compressibility factor (equations
(2)
to (4)):
Where
 is
pressure;
is
pressure;  ,
temperature;
,
temperature;  ,
molar volume of the mixture and
,
molar volume of the mixture and  ,
the universal constant of gases in corresponding units. The value of the
parameters
,
the universal constant of gases in corresponding units. The value of the
parameters  ,
,
 ,
,
 and
and
 are
defined according to the critical and reduced properties of the mixture
are
defined according to the critical and reduced properties of the mixture  and
Pitzer's acentric factor
and
Pitzer's acentric factor  (Pitzer
& Curl Jr, 1957), as shown in
Table 1.
(Pitzer
& Curl Jr, 1957), as shown in
Table 1.
·
Mixing rules
The
parameters and
of
cubic equations of state require mixing rules. The parameter b represents the
effective molar volume, in the case of mixtures containing molecules of
approximately equal size; it is possible to express the mixing rule according
to equation (5)
Table 1. Parameters used in
cubic equations of state (Poling, Prausnitz, & Connell, 2000b).
|
Equation
|
Parameters
|
|
SRK
|


|
|
PR
|


|
Where
 is
used as a variable of generic composition for both liquid and vapor roots. The
parameter represents
the molecular interactions of the mixture, therefore, its relationship with the
internal energy of the mixture
is
used as a variable of generic composition for both liquid and vapor roots. The
parameter represents
the molecular interactions of the mixture, therefore, its relationship with the
internal energy of the mixture  must
be carefully considered. The generating function for internal energy indicates
the following relationship (Elliott
& Lira, 1999):
must
be carefully considered. The generating function for internal energy indicates
the following relationship (Elliott
& Lira, 1999):
|
|

|
(6)
|
In
a binary mixture there are three types of interactions for molecules 1 and 2:
the molecule interacting with itself (1-1, 2-2) or interacting with each other
(1-2). For a random fluid, the probability of finding the molecule (1) is the
fraction  .
The probability of a 1-1 interaction is called conditional probability, this
probability is calculated as the product of the individual probabilities
.
The probability of a 1-1 interaction is called conditional probability, this
probability is calculated as the product of the individual probabilities  . The probability of interaction 1-2
or 2-1 is
. The probability of interaction 1-2
or 2-1 is  .
If the attraction interactions are characterized by
.
If the attraction interactions are characterized by  ,
,
 and
and
 ;
the mixing rule for is
given by equation (7)
;
the mixing rule for is
given by equation (7)
The
simplified form of equation (7)
is represented by equations (8)
and (9):
Where
 represents
the binary combination parameter, which is tabulated in the literature.
represents
the binary combination parameter, which is tabulated in the literature.
Approach
based on the multi-fluid concept
The
multi-fluid approach uses equations of state in their fundamental form for each
component of the mixture, in conjunction with functions developed for the
binary mixtures between the components, in order to determine the residual
behavior of the mixture (Kunz
& Wagner, 2012). The
GERG2008 EOS allows to calculate the thermodynamic properties of 21 components
of natural gas and their binary mixtures as shown in Table
2. The Multi-Fluid
Helmholtz-Free-Energy-Explicit approach,  which
is a function of density
which
is a function of density  ,
temperature
,
temperature  and
the molar composition vector
and
the molar composition vector  contains
the general form of the equation (10):
contains
the general form of the equation (10):
For
modeling, the dimensionless Helmholtz free energy was used, as follows:
|
|

|
(11)
|
Where
 corresponds
to the Helmholtz free energy component of the mixture as ideal gas, depending
on
corresponds
to the Helmholtz free energy component of the mixture as ideal gas, depending
on  :
:
The
term  is
the residual component of Helmholtz free energy of the mixture, depending on
is
the residual component of Helmholtz free energy of the mixture, depending on  .
.
Where
 is
the reduced density of the mixture,
is
the reduced density of the mixture,  is
the inverse of the reduced temperature of the mixture and
is
the inverse of the reduced temperature of the mixture and  is
the maximum number of present components.
is
the maximum number of present components.  is
the residual part of the Helmholtz free energy reduced from component
is
the residual part of the Helmholtz free energy reduced from component  and
and
 it
is the generating function. Equation (13) takes
into account the residual behavior of the mixture, evaluated at the reduced
properties and
.
Another way to express the residual Helmholtz free energy is through equation (17); where the first term corresponds to the linear
contribution of the reduced residual Helmholtz free energy, multiplied by the
molar fractions
it
is the generating function. Equation (13) takes
into account the residual behavior of the mixture, evaluated at the reduced
properties and
.
Another way to express the residual Helmholtz free energy is through equation (17); where the first term corresponds to the linear
contribution of the reduced residual Helmholtz free energy, multiplied by the
molar fractions  . The double sum of the next term is
equivalent to the generating function.
. The double sum of the next term is
equivalent to the generating function.
The
dimensionless form of Helmholtz free energy as the ideal gas of component in
equation (12) is defined as:
|

|
(18)
|
Where
 and
and
 are
the critical parameters of the pure components. For a specific binary
generating function, the adjustable factor
are
the critical parameters of the pure components. For a specific binary
generating function, the adjustable factor  normally
it is represented as one (1) if the mixture exists and zero (0) if it does not
exist. The residual part of the Helmholtz free energy for the compound as the
ideal gas is represented by the equation
(19).
normally
it is represented as one (1) if the mixture exists and zero (0) if it does not
exist. The residual part of the Helmholtz free energy for the compound as the
ideal gas is represented by the equation
(19).
Table 2. Components of
natural gas and its specific EOS of the pure component (Kunz & Wagner, 2012).
|
Comp.
|
EOS Ref.
|
Range of
validity
|
|
 * *
|
 * *
|
|
Main components
|
|

|
(Klimeck,
2000)
|
90 - 623
|
300
|
|

|
(Klimeck,
2000)
|
63 - 700
|
300
|
|

|
(Klimeck,
2000)
|
216 - 900
|
300
|
|

|
(Klimeck,
2000)
|
90 - 623
|
300
|
|
Secondary alkanes
|
|

|
(Span
& Wagner, 2003)
|
85 - 623
|
100
|
|

|
(Span
& Wagner, 2003)
|
134 - 693
|
70
|
|

|
(Span
& Wagner, 2003)
|
113 - 573
|
35
|
|

|
(Span
& Wagner, 2003)
|
143 - 573
|
70
|
|

|
(Lemmon
& Span, 2006)
|
112 - 500
|
35
|
|

|
(Span
& Wagner, 2003)
|
177 - 548
|
100
|
|

|
(Span
& Wagner, 2003)
|
182 - 523
|
100
|
|

|
(Span
& Wagner, 2003)
|
216 - 548
|
100
|
|

|
(Lemmon
& Span, 2006)
|
219 - 600
|
800
|
|

|
(Lemmon
& Span, 2006)
|
243 - 675
|
800
|
|
Other secondary
components
|
|

|
(Kunz
& Wagner, 2012)
|
14 – 700
|
300
|
|

|
(Span
& Wagner, 2003)
|
54 – 303
|
100
|
|

|
(Lemmon
& Span, 2006)
|
68 – 400
|
100
|
|

|
(Kunz
& Wagner, 2012)
|
273 – 1273
|
100
|
|

|
(Lemmon
& Span, 2006)
|
187 – 760
|
170
|
|

|
(Kunz
& Wagner, 2012)
|
2,2 – 573
|
100
|
|

|
(Span
& Wagner, 2003)
|
83 - 520
|
100
|
*
T in K and P in MPa
The
function  of
equation (17) depends only on
the reduced variables of the mixture and
,
it is represented in equation (20):
of
equation (17) depends only on
the reduced variables of the mixture and
,
it is represented in equation (20):
The
reduced variables of the mixture and
are
calculated from equations (15) and (16) respectively by means of dependent
functions of the composition, as shown in the equations (21)
and (22).
The binary parameters  and
and
 of
equation (21)
and
of
equation (21)
and  and
and
 of
equation (22),
as well as the critical parameters and
are
tabulated in Kunz and Wagner (Kunz
& Wagner, 2012).
of
equation (22),
as well as the critical parameters and
are
tabulated in Kunz and Wagner (Kunz
& Wagner, 2012).
Mixing
Rules
For
the binary mixtures that are formed from the 21 components of the GERG2008 model,
five different mixing rules are used, shown in Figure 2.
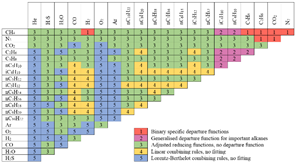
Figure 2. Binary combinations and mixing rules for
each of the possible combinations (Kunz & Wagner, 2012).
·
Calculation of the dew point
There
is a variation in the prediction of the thermodynamic properties of multiphase
mixtures depending on the applied equations of state, since each equation is
dependent on empirical parameters and different mixing rules, it is required to
determine the equation that best describes the mixture of natural gas. The
general algorithm applied for the calculation of the dew point is shown in Figure
3. The equations of Soave-Redlich-Kwong,
Peng-Robinson and GERG2008 were used as the procedure to determine the equation
of state that allows the accurate estimation of the properties of the natural
gas so as to construct the equilibrium curves of different synthetic and real
mixtures of natural gas from Norway and the Middle East. These curves,
performed in Aspen-Hysys v8.8 were compared with experimental equilibrium
curves from laboratory tests.
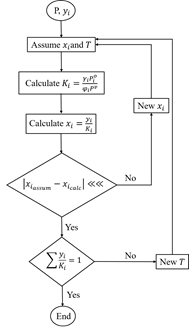
Figure 3. Algorithm for the calculation of dew
points.
After
its validation, the selected equation of state was used to estimate the dew
points and the cricondenbar and cricondentherm points of natural gas mixtures
from Colombian oil fields; considered “low impact”, for having a production
volume lower than 1 MMSCFD. The application of this study is focused on the
determination of the appropriate conditions, limits and operating intervals on
which it is possible to have a liquid gas mixture in equilibrium without
reaching the supercritical fluid zone. The results will facilitate studies of
phase separation systems of natural gas at high pressure by gravitational,
centrifugal or supersonic techniques, in plants where the cost of
re-compression is considerably high.
·
Characterization of mixtures
In
this study, several mixtures of natural gas with potential for phase separation
in a range of operating pressure between 4 and 10 MPa were selected. In this
regard, Valiollahi et al (2016)
collected a set of 36 mixtures of natural gas, of
which, 23 of them have the present components in the GERG2008 state equation
and 5 have high separation potential at high pressure according to the analysis
of the experimental equilibrium curves. Table 3
presents the molar percentage of each of the mixtures used in the thermodynamic
analysis and the Table 5
shows the results of the experimental equilibrium curves of the mixtures, which
were compared with the curves constructed by different EOS.
Table 3. Molar percentage of selected natural gas
mixtures and its respective reference.
|
ID
|
Gas 1
|
Gas 2
|
Gas 3
|
Gas 4
|
Gas 5
|
|
Ref.
|
(Jarne
et al., 2004)
|
(Mørch
et al., 2006)
|
(Mørch
et al., 2006)
|
(Avila,
et al, 2002)
|
(Jarne
et al., 2004)
|
|
|
84.45
|
96.611
|
93.6
|
83.35
|
69.11
|
|
|
0.772
|
0
|
0
|
5.651
|
1.559
|
|
|
1.7
|
0
|
0
|
0.284
|
25.91
|
|

|
8.683
|
0
|
2.630
|
7.526
|
2.62
|
|

|
3.297
|
0
|
1.49
|
2.009
|
0.423
|
|

|
0.589
|
1.475
|
1.49
|
0.52
|
0.104
|
|

|
0.293
|
1.527
|
0.795
|
0.305
|
0.105
|
|

|
0.086
|
0.385
|
0
|
0.144
|
0.023
|
|

|
0.084
|
0
|
0
|
0.12
|
0.034
|
|

|
0.05
|
0
|
0
|
0.068
|
0.11
|
|

|
0
|
0
|
0
|
0.014
|
0
|
|

|
0
|
0
|
0
|
0.011
|
0
|
·
Colombian natural gas mixtures
In
addition to the real and synthetic natural gas mixtures that were extracted
from the literature (Avila
et al., 2002; Jarne et al., 2004; Mørch et al., 2006),
two mixtures of natural gas from Colombian reservoirs were analyzed. The molar
percentage of the Colombian natural gas mixtures used during the present study
are shown in Table 4.
Table 4. Molar
percentage of gases from Colombian fields.
|
%mol
|
Gas 6
|
Gas 7
|
%mol
|
Gas 6
|
Gas 7
|
|
|
97.299
|
82.867
|

|
0.013
|
0.024
|
|
|
1.507
|
0.541
|

|
0.023
|
0.033
|
|
|
0.095
|
2.008
|

|
0.009
|
0.006
|
|
|
0.69
|
8.828
|

|
0.004
|
0.004
|
|
|
0.241
|
3.86
|

|
0.002
|
0.001
|
|
|
0.062
|
1.19
|

|
0.001
|
0
|
|
|
0.054
|
0.638
|
|
|
|
Table 5. Values of the cricondentherm point (K),
cricondenbar point (MPa) and experimental equilibrium curves for different
mixtures of natural gas (Avila et al., 2002; Jarne et al., 2004; Mørch et al., 2006).
|
Gas 1
|
Gas 2
|
Gas 3
|
Gas 4
|
Gas 5
|
|
CricT (K)
|
261.4
|
CricT (K)
|
268.3
|
CricT (K)
|
278.4
|
CricT (K)
|
273.5
|
CricT (K)
|
252.2
|
|
CricB (MPa)
|
8.18
|
CricB (MPa)
|
--
|
CricB (MPa)
|
--
|
CricB (MPa)
|
9.23
|
CricB (MPa)
|
--
|
|
T(K)
|
P(MPa)
|
T(K)
|
P(MPa)
|
T(K)
|
P(MPa)
|
T(K)
|
P(MPa)
|
T(K)
|
P(MPa)
|
|
217.9
|
0.12
|
263.7
|
7.92
|
268.7
|
9.32
|
243.4
|
0.2
|
213.6
|
0.12
|
|
219.6
|
0.14
|
265.3
|
7.54
|
271.2
|
9.04
|
249.8
|
0.32
|
216.4
|
0.12
|
|
222.6
|
0.21
|
266.1
|
7.06
|
272.4
|
8.52
|
254.1
|
0.5
|
217.5
|
0.13
|
|
228.1
|
0.31
|
267
|
6.56
|
274.3
|
8.1
|
258.3
|
0.7
|
219.5
|
0.14
|
|
232.1
|
0.41
|
267.8
|
6.04
|
275.3
|
7.68
|
262.4
|
0.99
|
222
|
0.17
|
|
235.9
|
0.53
|
268.3
|
5.56
|
276.1
|
7.16
|
266.7
|
1.47
|
224.5
|
0.21
|
|
238.7
|
0.64
|
268.2
|
5.06
|
277.6
|
6.64
|
269.7
|
2.01
|
228.5
|
0.29
|
|
240.7
|
0.73
|
268
|
4.58
|
278.4
|
6.18
|
271.4
|
2.46
|
231.5
|
0.38
|
|
242.5
|
0.86
|
267.4
|
4.1
|
278.3
|
5.64
|
272.7
|
3.06
|
233.4
|
0.44
|
|
244.4
|
0.98
|
266.4
|
3.58
|
278.4
|
5.12
|
273.2
|
3.51
|
235.6
|
0.52
|
|
247.1
|
1.18
|
264.9
|
3.08
|
277.5
|
4.62
|
273.3
|
4
|
237.8
|
0.63
|
|
259.9
|
6.24
|
262.8
|
2.6
|
276.6
|
4.08
|
273.5
|
4.5
|
239.4
|
0.72
|
|
259.1
|
6.51
|
259.9
|
2.08
|
275.7
|
3.6
|
273.2
|
5
|
241.3
|
0.85
|
|
258.1
|
6.76
|
255.9
|
1.58
|
273.6
|
3.1
|
272.5
|
5.5
|
243.2
|
1.01
|
|
256.5
|
6.98
|
249.7
|
1.06
|
271.3
|
2.6
|
271.8
|
6.01
|
245.1
|
1.2
|
|
255.9
|
7.19
|
241.9
|
0.64
|
268.5
|
2.08
|
269.4
|
6.62
|
246.7
|
1.42
|
|
254-2
|
7.54
|
|
|
264.1
|
1.56
|
267.6
|
7.14
|
248.9
|
1.8
|
|
253.5
|
7.59
|
|
|
258.1
|
1.06
|
264.6
|
7.53
|
249.8
|
2.02
|
|
252-4
|
7.77
|
|
|
247.9
|
0.58
|
262.1
|
8.02
|
250.5
|
2.22
|
|
251-4
|
7.78
|
|
|
240.8
|
0.34
|
257.9
|
8.48
|
251.1
|
2.42
|
|
234
|
7.92
|
|
|
|
|
252.1
|
8.85
|
251.5
|
2.64
|
|
234.8
|
7.93
|
|
|
|
|
246.1
|
9.14
|
251.9
|
2.88
|
|
|
|
|
|
|
|
241.9
|
9.23
|
252.1
|
3.14
|
|
|
|
|
|
|
|
231.,4
|
9.05
|
252.2
|
3.37
|
|
|
|
|
|
|
|
228.1
|
8.87
|
252.2
|
3.83
|
|
|
|
|
|
|
|
223.3
|
8.28
|
251.3
|
4.5
|
|
|
|
|
|
|
|
215.7
|
7.42
|
250.7
|
4.79
|
|
|
|
|
|
|
|
|
|
249.5
|
5.2
|
|
|
|
|
|
|
|
|
|
248.1
|
5.61
|
|
|
|
|
|
|
|
|
|
246.4
|
6.02
|
Results
and discussion
The
discussion of results is divided into the analysis of the cricondentherm and
cricondenbar points of the mixtures presented in the studies by Mørch et al. (2006),
Jarne et al. (2004)
and Avila et al. (2002),
the construction and comparison of equilibrium curves and the analysis of
natural gas mixtures from Colombian fields. Figure
4 shows the experimental values and the results of
the calculation using the PR, SRK and GERG2008 state of equations for each of
the selected natural gas mixtures. Table
6 also contains the absolute error percentage of each
state equation compared to the experimental data.
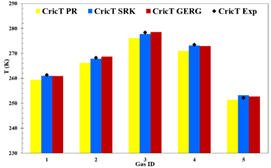
Figure 4. Experimental and simulated value of the
cricondentherm point for each of the analysis gases.
Table 6. . Calculation of absolute error for each
one of the cricondentherm points, using the PR, SRK and GERG2008 EOS vs.
Experimental data.
|
Cric (K)
|
Gas1
|
%e
|
Gas2
|
%e
|
Gas3
|
%e
|
|
Exp.
|
261.4
|
--
|
268.3
|
--
|
278.4
|
--
|
|
PR
|
259.4
|
0.77
|
266.2
|
0.78
|
276.1
|
0.83
|
|
SRK
|
261
|
0.15
|
267.8
|
0.19
|
277.8
|
0.22
|
|
GERG2008
|
260.9
|
0.19
|
268.7
|
0.15
|
278.6
|
0.07
|
|
|
Gas4
|
%e
|
Gas5
|
%e
|
|
|
|
Expl
|
273.5
|
--
|
252.2
|
--
|
|
|
|
PR
|
271
|
0.91
|
251.4
|
0.32
|
|
|
|
SRK
|
273.2
|
0.11
|
253.2
|
0.40
|
|
|
|
GERG2008
|
273
|
0.18
|
252.7
|
0.20
|
|
|
In
the case of the cricondentherm point, it is observed that, for three of the
five experimental mixtures, the lowest percentage of error was presented using
the GERG2008 state equation. The maximum percentage reached was using the PR
equation in gas 4 (0.91%). However, since all the percentages of error are so
low, it is considered that it is not a sufficient measure for the selection and
that other properties must be analyzed. Similarly to the cricondentherm point, Figure
5 and Table
7 present the comparison and the calculation of
percentage of error of the cricondenbar points for the mixtures of natural gas
that are adapted to the process of stage separation at high pressure. According
to the available experimental data, it is observed that both the SRK and
GERG2008 state equations have a low percentage of error when calculating the
values of the maximum pressure where the liquid and gas phases coexist in
equilibrium.
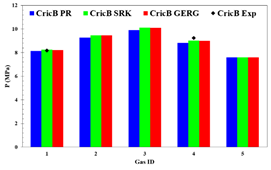
Figure 5. Experimental and simulated value of the
cricondenbar point for each of the analysis gases.
Table 7. Calculation of absolute error for each one
of the cricondenbar points, using the PR, SRK and GERG2008 EOS vs. Experimental
data.
|
Cric (MPa)
|
Gas1
|
%e
|
Gas2
|
%e
|
Gas3
|
%e
|
|
Exp.
|
8.18
|
--
|
--
|
--
|
--
|
--
|
|
PR
|
8.134
|
0.56
|
9.269
|
--
|
9.902
|
--
|
|
SRK
|
8.247
|
0.82
|
9.466
|
--
|
10.11
|
--
|
|
GERG2008
|
8.218
|
0.46
|
9.459
|
--
|
10.09
|
--
|
|
|
Gas4
|
%e
|
Gas5
|
%e
|
|
|
|
Expl
|
9.23
|
--
|
--
|
--
|
|
|
|
PR
|
8.828
|
4.36
|
7.595
|
--
|
|
|
|
SRK
|
9.02
|
2.28
|
7.606
|
--
|
|
|
|
GERG2008
|
8.999
|
2.50
|
7.596
|
--
|
|
|
Once
again, in light of this information, any of the three state equations would be
adequate to estimate the cricondenbar and cricondentherm points; so it is not
enough to make a decision, it is necessary to study the behavior of the
pressure depending on the temperature for each of the mixtures of Table
3. After analyzing the cricondentherm and
cricondenbar points of the five natural gas mixtures, the pressure profiles
were plotted as a function to temperature (Figure
8) and later they were compared with experimental
data.
The
calculated equilibrium curves show that at low pressures, all the state
equations analyzed have a good correlation with the experimental data, thus the
equation that is used to estimate the thermodynamic properties of the mixtures
is considered indifferent, that is, any of the three works with relatively low
error rates. However, if the objective is to operate high-pressure multiphase
separation systems, not all state equations are adequate; as it is the case of
the Peng-Robinson equation, where in none of the dew curves the real behavior
of the mixture was represented, especially near the cricondentherm and
cricondenbar points; in this last point the Peng equation Robinson reaches the
maximum error rate of 4.36% for gas 4 (Table
7).
Discarding
the Peng-Robinson's equation of state for the calculation of the dew curve of
high-pressure natural gas mixtures, the state equation was established that
estimates the thermodynamic properties of the multi-component system. In Figure
8, it is possible to observe that in spite of not
existing a significant difference between the two remaining equations of state,
the dew curve calculated with the GERG2008 equation is the one that better
correlates the experimental data of the literature; this trend is more evident
in the results of gases 2, 3, and 4. As a special case, gas 5 starts with a
favorable trend for the GERG2008 equation and as the pressure increases, the
Soave-Redlich-Kwong equation is closer to the real trend in a small section of
the dew curve, unfortunately there is no experimental data in the region of the
cricondenbar point.
Application
to Colombian natural gas mixtures
Figure 8 suggests
that the GERG2008 state equation manages to adequately reproduce the
thermodynamic behavior of different types of synthetic and real mixtures of
natural gas. For this reason, two real mixtures of natural gas from Colombian
production fields were chosen (Table 4). The first (Figure 6) corresponds to a “dry” natural gas,
mainly composed of methane and therefore has a low separation potential, due to
the lack of heavy hydrocarbons ( hereinafter), this gas is especially suitable for use in electric
power generation systems.
hereinafter), this gas is especially suitable for use in electric
power generation systems.
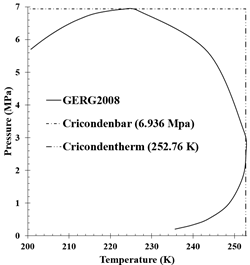
Figure 6. Colombian natural gas 6 phase envelope and
properties calculated with the GERG2008 equation of state.

Figure 7. Colombian natural gas 7 phase envelope and
properties calculated with the GERG2008 equation of state.
The
second mixture (Figure
7) is a “wet” gas, in addition to methane contains
considerable amounts of ethane, propane, butane, among others (Table
4), additionally has 2% of  ;
this gas, apart from going through a phase separation process, could be
subjected to a treatment with amines or membranes for its sweetening (removal
or reduction of
;
this gas, apart from going through a phase separation process, could be
subjected to a treatment with amines or membranes for its sweetening (removal
or reduction of  ).
).
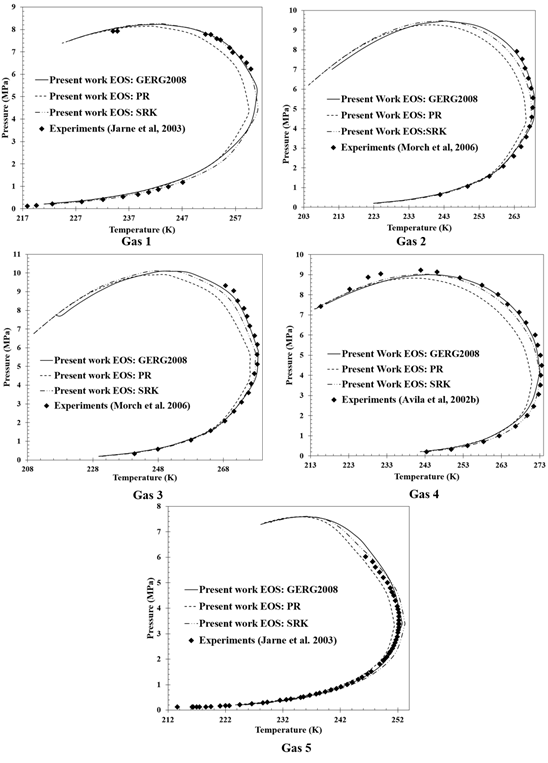
Figure 8
Comparison of the calculate phase equilibrium curves
with the experimental data.
Both
the dew curve and the cricondentherm and cricondenbar points show that for this
humid gas there is a range of pressure and temperature conditions for which it
is possible to carry out phase separation and recommend an operating pressure
value in the separator close to the of the container well, which for Colombian
natural gas wells is between 7 and 10 MPa.
Conclusion
From
equilibrium experimental curves of five real and synthetic natural gas mixtures
from the literature, equilibrium curves were constructed, compared and
correlated using three different equations of state: Peng-Robinson, Soave-Redlich-Kwong
and GERG2008. The results showed that there is no significant difference in the
calculation of the cricondentherm points, presenting a maximum absolute error
of 1% with respect to the real values. The calculation of the cricondenbar points
yielded a maximum absolute error of 4.36% when the Peng-Robinson equation of
state was used; therefore, both the Soave-Redlich-Kwong equation and the
GERG2008 equation have low error rates, compared to the experimental points.
Regarding the equilibrium curves, at low pressures the equation of state used
to estimate the thermodynamic properties of natural gas is indifferent,
however, as the pressure increases the Peng-Robinson equation is not suitable
for represent the behavior of the multiphase and multicomponent system. The
results suggest that, as long as the mixture contains the 21 present components
in the GERG2008 state equation, this is the equation that best estimates the
thermodynamic properties of the mixtures. In case of having additional components
to those of Table
2 it is possible to use the Soave-Redlich-Kwong
equation to calculate the equilibrium curves, since the results show that the
error percentages are low for high pressure conditions. Finally, when
performing the dew curves for two gas mixtures from Colombian fields using the
GERG2008 state equation, it is possible to affirm that for “wet” gases there is
a potential opportunity to carry out stage separation at high pressure, thus
making it possible to eliminate or reduce the expenses associated with
re-compression during the natural gas processing.
Acknowledgements
The
authors wish to acknowledge to the Universidad Industrial de Santander
for the academic support and COLCIENCIAS for the financial support.
References
Austrheim,
T., Gjertsen, L. H., & Hoffmann, A. C. (2008). Experimental investigation
of the performance of a large-scale scrubber operating at elevated pressure on
live natural gas. Fuel, 87(7), 1281–1288.
Brigadeau, A. H. M.
(2007). Modeling and Numerical Investigation of High Pressure Gas-Liquid
Separation. Fakultet for ingeniørvitenskap og teknologi.
Elliott, J. R., &
Lira, C. T. (1999). Introductory chemical engineering thermodynamics
(Vol. 184). Prentice Hall PTR Upper Saddle River, NJ.
Galatro, D., &
Marín-Cordero, F. (2014). Considerations for the dew point calculation in rich
natural gas. Journal of Natural Gas Science and Engineering, 18,
112–119. https://doi.org/10.1016/J.JNGSE.2014.02.002
González-Silva, G., Matos, E.,
Martignoni, W., & Mori, M. (2012). The
importance of 3D mesh generation for large eddy simulation of gas–solid
turbulent flows in a fluidized beds. Int. J. Chem. Mol. Nucl. Mater. Metall.
Eng., 6(8), 770–777.
Guo, B., &
Ghalambor, A. (2014). Natural Gas Engineering Handbook. Elsevier.
Jia, W., Wu, X., Li,
C., & He, Y. (2017). Characteristic analysis of a non-equilibrium
thermodynamic two-fluid model for natural gas liquid pipe flow. Journal of
Natural Gas Science and Engineering, 40, 132–140.
https://doi.org/10.1016/J.JNGSE.2017.01.036
Jiménez, N. P., Hodapp,
M. J., Silva, M. G. E., & Mori, M. (2010). Simulation
of the coke combustion in a FCC regenerator using Computational Fluid Dynamics.
Khanwelkar, S. (2015). Natural
Gas Processing. Scitus Academics LLC.
Kharoua, N., Khezzar,
L., & Saadawi, H. (2013). CFD Modelling of a Horizontal Three-Phase
Separator: A Population Balance Approach. American Journal of Fluid Dynamics,
3(4), 101–118. Retrieved from The
Klimeck, R. (2000). Entwicklung
einer Fundamentalgleichung für Erdgase für das Gas- und Flüssigkeitsgebiet
sowie das Phasengleichgewicht /. Bochum Universitat. Retrieved from
https://www.researchgate.net/publication/34445557_Entwicklung_einer_Fundamentalgleichung_fur_Erdgase_fur_das_Gas-_und_Flussigkeitsgebiet_sowie_das_Phasengleichgewicht
Kunz, O., & Wagner,
W. (2012). The GERG-2008 Wide-Range Equation of State for Natural Gases and
Other Mixtures: An Expansion of GERG-2004. Journal of Chemical &
Engineering Data, 57(11), 3032–3091.
https://doi.org/10.1021/je300655b
Laleh, A. P., Svrcek,
W. Y., & Monnery, W. D. (2012). Design and CFD studies of multiphase
separators—a review. The Canadian Journal of Chemical Engineering, 90(6),
1547–1561. https://doi.org/10.1002/cjce.20665
Lemmon, E. W., &
Span, R. (2006). Short Fundamental Equations of State for 20 Industrial Fluids.
Journal of Chemical & Engineering Data, 51(3), 785–850.
https://doi.org/10.1021/je050186n
Mokhatab, S., Poe, W.
A., & Mak, J. Y. (2015). Chapter 3 - Basic Concepts of Natural Gas
Processing. In Handbook of Natural Gas Transmission and Processing (Third
Edition) (pp. 123–135). Boston: Gulf Professional Publishing.
Peng, D.-Y., &
Robinson, D. B. (1976). A New Two-Constant Equation of State. Industrial
& Engineering Chemistry Fundamentals, 15(1), 59–64.
https://doi.org/10.1021/i160057a011
Pitzer, K. S., &
Curl Jr, R. (1957). The volumetric and thermodynamic properties of fluids. III.
Empirical equation for the second virial coefficient1. Journal of the
American Chemical Society, 79(10), 2369–2370.
Poling, B., Prausnitz,
J., & Connell, J. O. (2000a). The Properties of Gases and Liquids 5E.
McGraw Hill Professional.
Poling, B., Prausnitz,
J., & Connell, J. O. (2000b). The Properties of Gases and Liquids 5E.
McGraw Hill Professional.
Shoaib, A. M., Bhran,
A. A., Awad, M. E., El-Sayed, N. A., & Fathy, T. (2018). Optimum operating
conditions for improving natural gas dew point and condensate throughput. Journal
of Natural Gas Science and Engineering, 49, 324–330.
https://doi.org/10.1016/J.JNGSE.2017.11.008
Silva, G. G., Jiménez,
N. P., & Salazar, O. F. (2012). Fluid Dynamics of
Gas-Solid Fluidized Beds. In Advanced Fluid Dynamics. InTech.
Silva, G. G., Prieto,
N., & Mercado, I. (2018). Large Eddy Simulation (LES)
Aplicado a un lecho fluidizado gas–sólido. Parte I: Reactor a escala de
laboratorio. Revista UIS Ingenierías, 17(1), 93–104.
Soave, G. (1972).
Equilibrium constants from a modified Redlich-Kwong equation of state. Chemical
Engineering Science, 27(6), 1197–1203.
https://doi.org/10.1016/0009-2509(72)80096-4
Span, R., & Wagner,
W. (2003). Equations of State for Technical Applications. II. Results for
Nonpolar Fluids. International Journal of Thermophysics, 24(1),
41–109. https://doi.org/10.1023/A:1022310214958
Valiollahi, S.,
Kavianpour, B., Raeissi, S., & Moshfeghian, M. (2016). A new Peng-Robinson
modification to enhance dew point estimations of natural gases. Journal of
Natural Gas Science and Engineering, 34, 1137–1147. https://doi.org/10.1016/j.jngse.2016.07.049
Zaghloul, J. S. (2006).
Multiphase Analysis of Three-phase (gas-condensate-water) Flow in Pipes.
ProQuest.
